Question 3. What is the probability that ‘fat tails’ arise by chance?
To answer this question, the same process as for Question 2 has been followed, i.e., a normal distribution with a mean of 8.5%, and standard deviation of 18.2% has been used to generate 4.5e7 samples (years) which are then split into 300000 individual periods each consisting of 150 years. The distribution of returns in each 150 year period of simulated returns was then compared with the overall distribution.
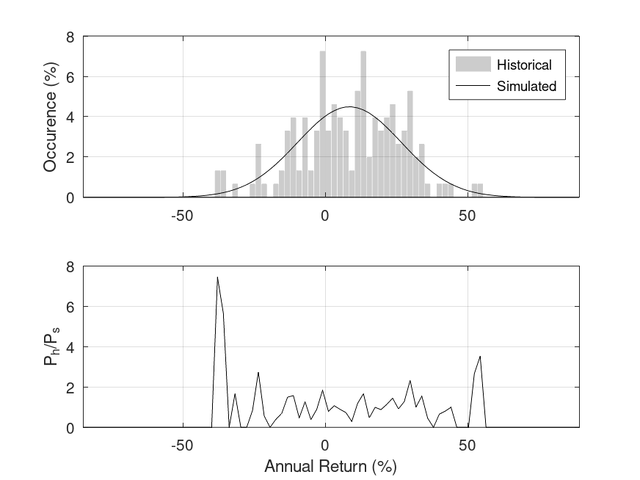
In order to illustrate what is meant by the ‘fat tails’, the upper panel in the following figure shows the historical distribution of annual real stock returns and that simulated using a normal distribution (mean=8.5%, stddev=18.2%, 4.5e7 samples). The lower panel, shows the historical occurrence, Ph divided by the simulated occurrence, Ps. Returns around -40% and, to a lesser extent, just over 50% occur much more frequently that expected (about 7 and 4 times more frequently, respectively).
![Image]()
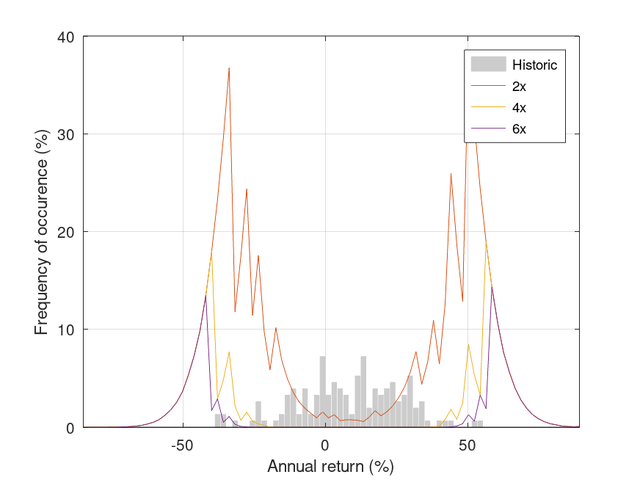
For the simulated data, P150/Ps can be calculated, where P150 is the probability density function for each of the 300000 150-year periods (i.e., similar to the lower panel of the above figure) and Ps is the population distribution (i.e., labelled as 'simulated' in the upper panel of the previous graph). The fraction of 150-year periods where P150/Ps exceeded 2x, 4x, and 6x that of the expected value, Ps is plotted in the following figure together with the historical distribution of returns.
![Image]()
It is interesting to note that by comparing 150-year periods of simulated data to the overall simulated distribution, extreme returns occur by chance quite frequently. The successive peaks in the above graph arise because the probability density function is quantised since periods of 150-years of simulated data were used (i.e., the probability at a given return goes up in 1/150=0.67% steps). It is also noteworthy that the extreme returns found historically are, more or less, aligned with the peaks in the above graph (and note the peaks in Ph/Ps in the lower panel of the earlier figure).
So, assuming that stock returns are random and normally distributed, there is some evidence to suggest that in a relatively small sample (~150 years), extreme returns will be found more often than expected about 10% to 30% of the time. This means that the cluster of extreme returns found in the historical data set may arise by chance because of the limited extent of the available data rather than indicating that a different distribution should be used.
That is probably enough posting for now - I'll upload some results looking at mean reversion later.
cheers
StillGoing
To answer this question, the same process as for Question 2 has been followed, i.e., a normal distribution with a mean of 8.5%, and standard deviation of 18.2% has been used to generate 4.5e7 samples (years) which are then split into 300000 individual periods each consisting of 150 years. The distribution of returns in each 150 year period of simulated returns was then compared with the overall distribution.
In order to illustrate what is meant by the ‘fat tails’, the upper panel in the following figure shows the historical distribution of annual real stock returns and that simulated using a normal distribution (mean=8.5%, stddev=18.2%, 4.5e7 samples). The lower panel, shows the historical occurrence, Ph divided by the simulated occurrence, Ps. Returns around -40% and, to a lesser extent, just over 50% occur much more frequently that expected (about 7 and 4 times more frequently, respectively).
For the simulated data, P150/Ps can be calculated, where P150 is the probability density function for each of the 300000 150-year periods (i.e., similar to the lower panel of the above figure) and Ps is the population distribution (i.e., labelled as 'simulated' in the upper panel of the previous graph). The fraction of 150-year periods where P150/Ps exceeded 2x, 4x, and 6x that of the expected value, Ps is plotted in the following figure together with the historical distribution of returns.
It is interesting to note that by comparing 150-year periods of simulated data to the overall simulated distribution, extreme returns occur by chance quite frequently. The successive peaks in the above graph arise because the probability density function is quantised since periods of 150-years of simulated data were used (i.e., the probability at a given return goes up in 1/150=0.67% steps). It is also noteworthy that the extreme returns found historically are, more or less, aligned with the peaks in the above graph (and note the peaks in Ph/Ps in the lower panel of the earlier figure).
So, assuming that stock returns are random and normally distributed, there is some evidence to suggest that in a relatively small sample (~150 years), extreme returns will be found more often than expected about 10% to 30% of the time. This means that the cluster of extreme returns found in the historical data set may arise by chance because of the limited extent of the available data rather than indicating that a different distribution should be used.
That is probably enough posting for now - I'll upload some results looking at mean reversion later.
cheers
StillGoing
Statistics: Posted by StillGoing — Fri Aug 02, 2024 2:04 am